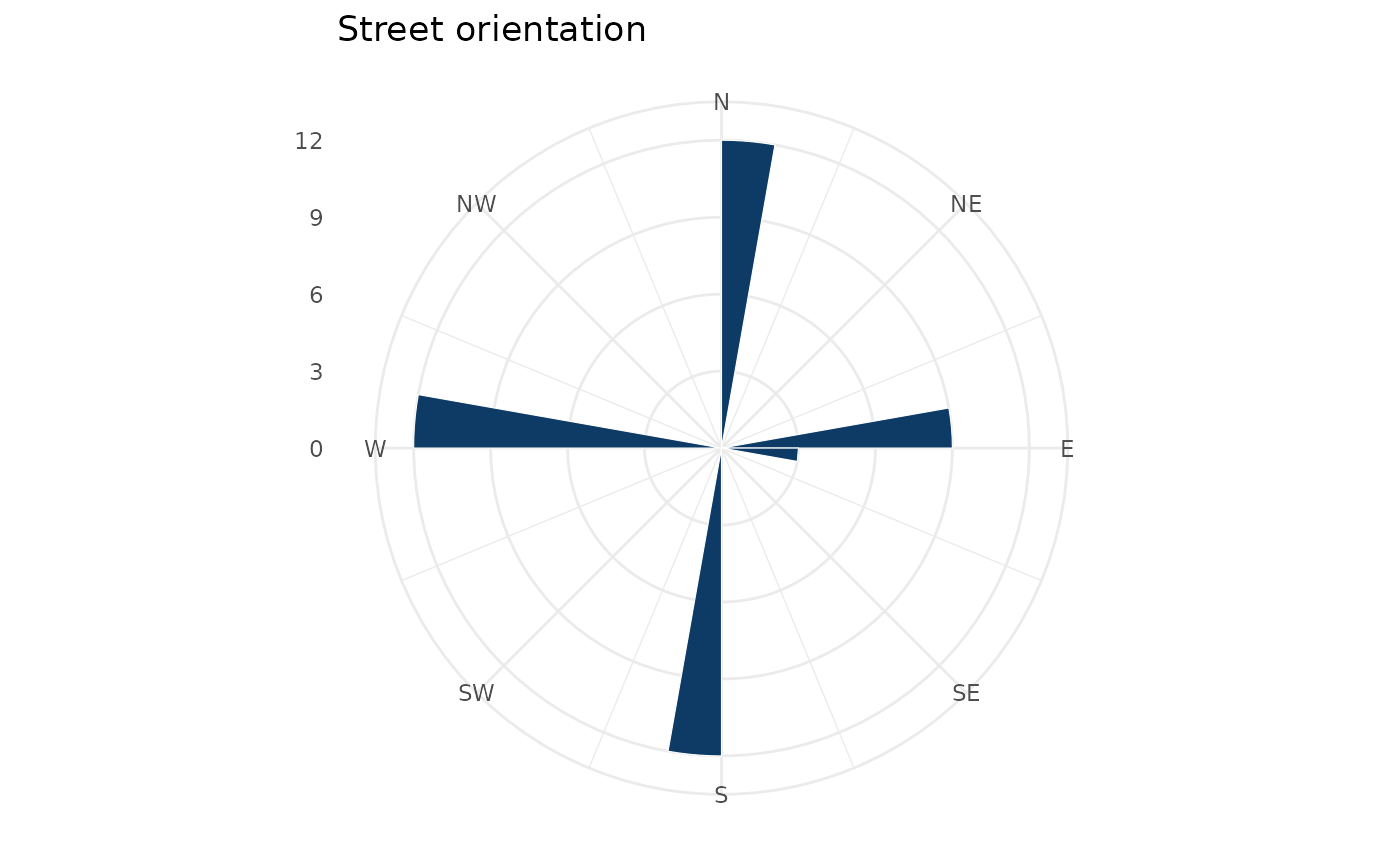
Draws a polar histogram (rose plot) of edge compass bearings, the standard
visual summary of a street network's orientation order. Requires ggplot2.
Arguments
- x
An osm_graph or a numeric vector of bearings (degrees), e.g. from
ox_bearings().- num_bins
Number of equal bearing sectors. Default
36.- fill
Bar fill colour. Default the package blue.
- title
Optional plot title.
Examples
g <- example_osm_graph()
ox_plot_orientation(g)